Stock Market Dashboard with Integrated Chatbot
A project that analyzes the stock market trends and integrates a chatbot to provide newcomers with insightful analysis and information about investing.
Project period: Sep 2024 - Dec 2024
Project team:
- Huynh Cao Khoi (Team leader)
- Nguyen Van Quang Hung
- Hoang Trung Nam
- Chiem Binh Nguyen
- Huynh Tri Nhan
- Nguyen Duc Manh
Roles:
- Team leading
- Data collecting and scheduler developing
- Dashboard building
Tools:
- Data Collecting: Selenium, Request, Airflow
- Database management: PostgesQL
- Dashboard building: Streamlit, Plotly
Overview
This project is the final assignment for the course “Intelligent Analysis for Data Science” , where I have to work in team, and our task is developing an interactive dashboard to present data analysis for a chosen topic.
Our team selected the Vietnam stock market as our focus, as it is a just a new topic for us. We hope that, from this project, beside the technical knowledge, we will also know more about investing and finance.
The goal of this project is to create a dashboard that visualizes the analysis on Vietnam stock market, also included a chatbot to support the newcomers. The chatbot can summarize recent news from articles and answer basic questions about the market state and trend.
Dataset
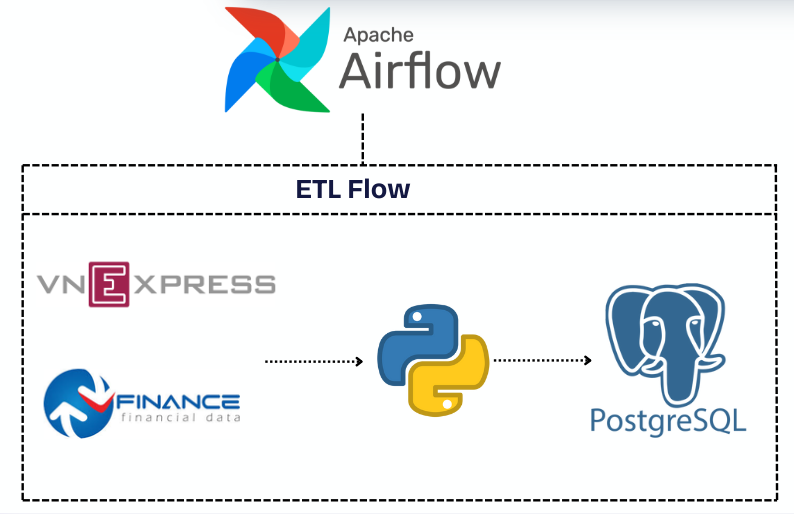
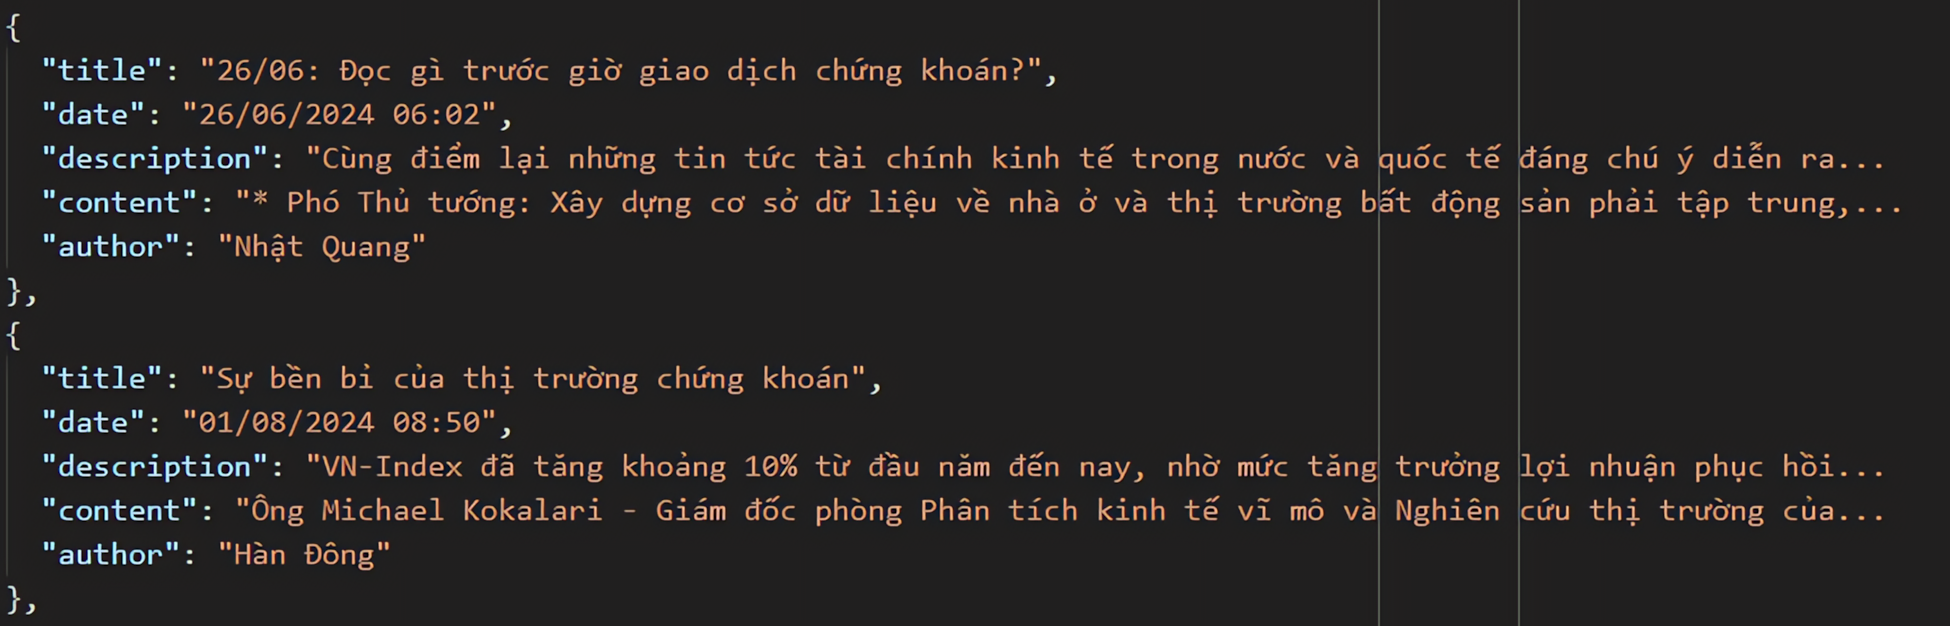
For the data sources, we collected two type of data: Historical stock market data from Vietstock Finance and article data from VNExpress and Vietstock.
The collected data will be stored in a PostgesQL database, I hosted it with a Render database The whole process is managed with Airflow.
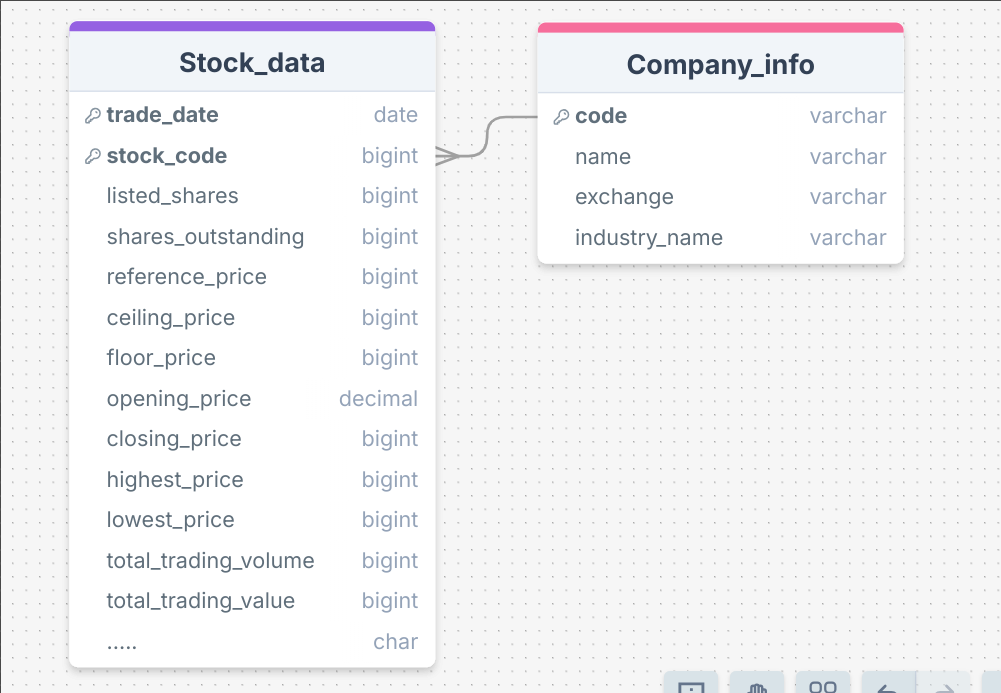
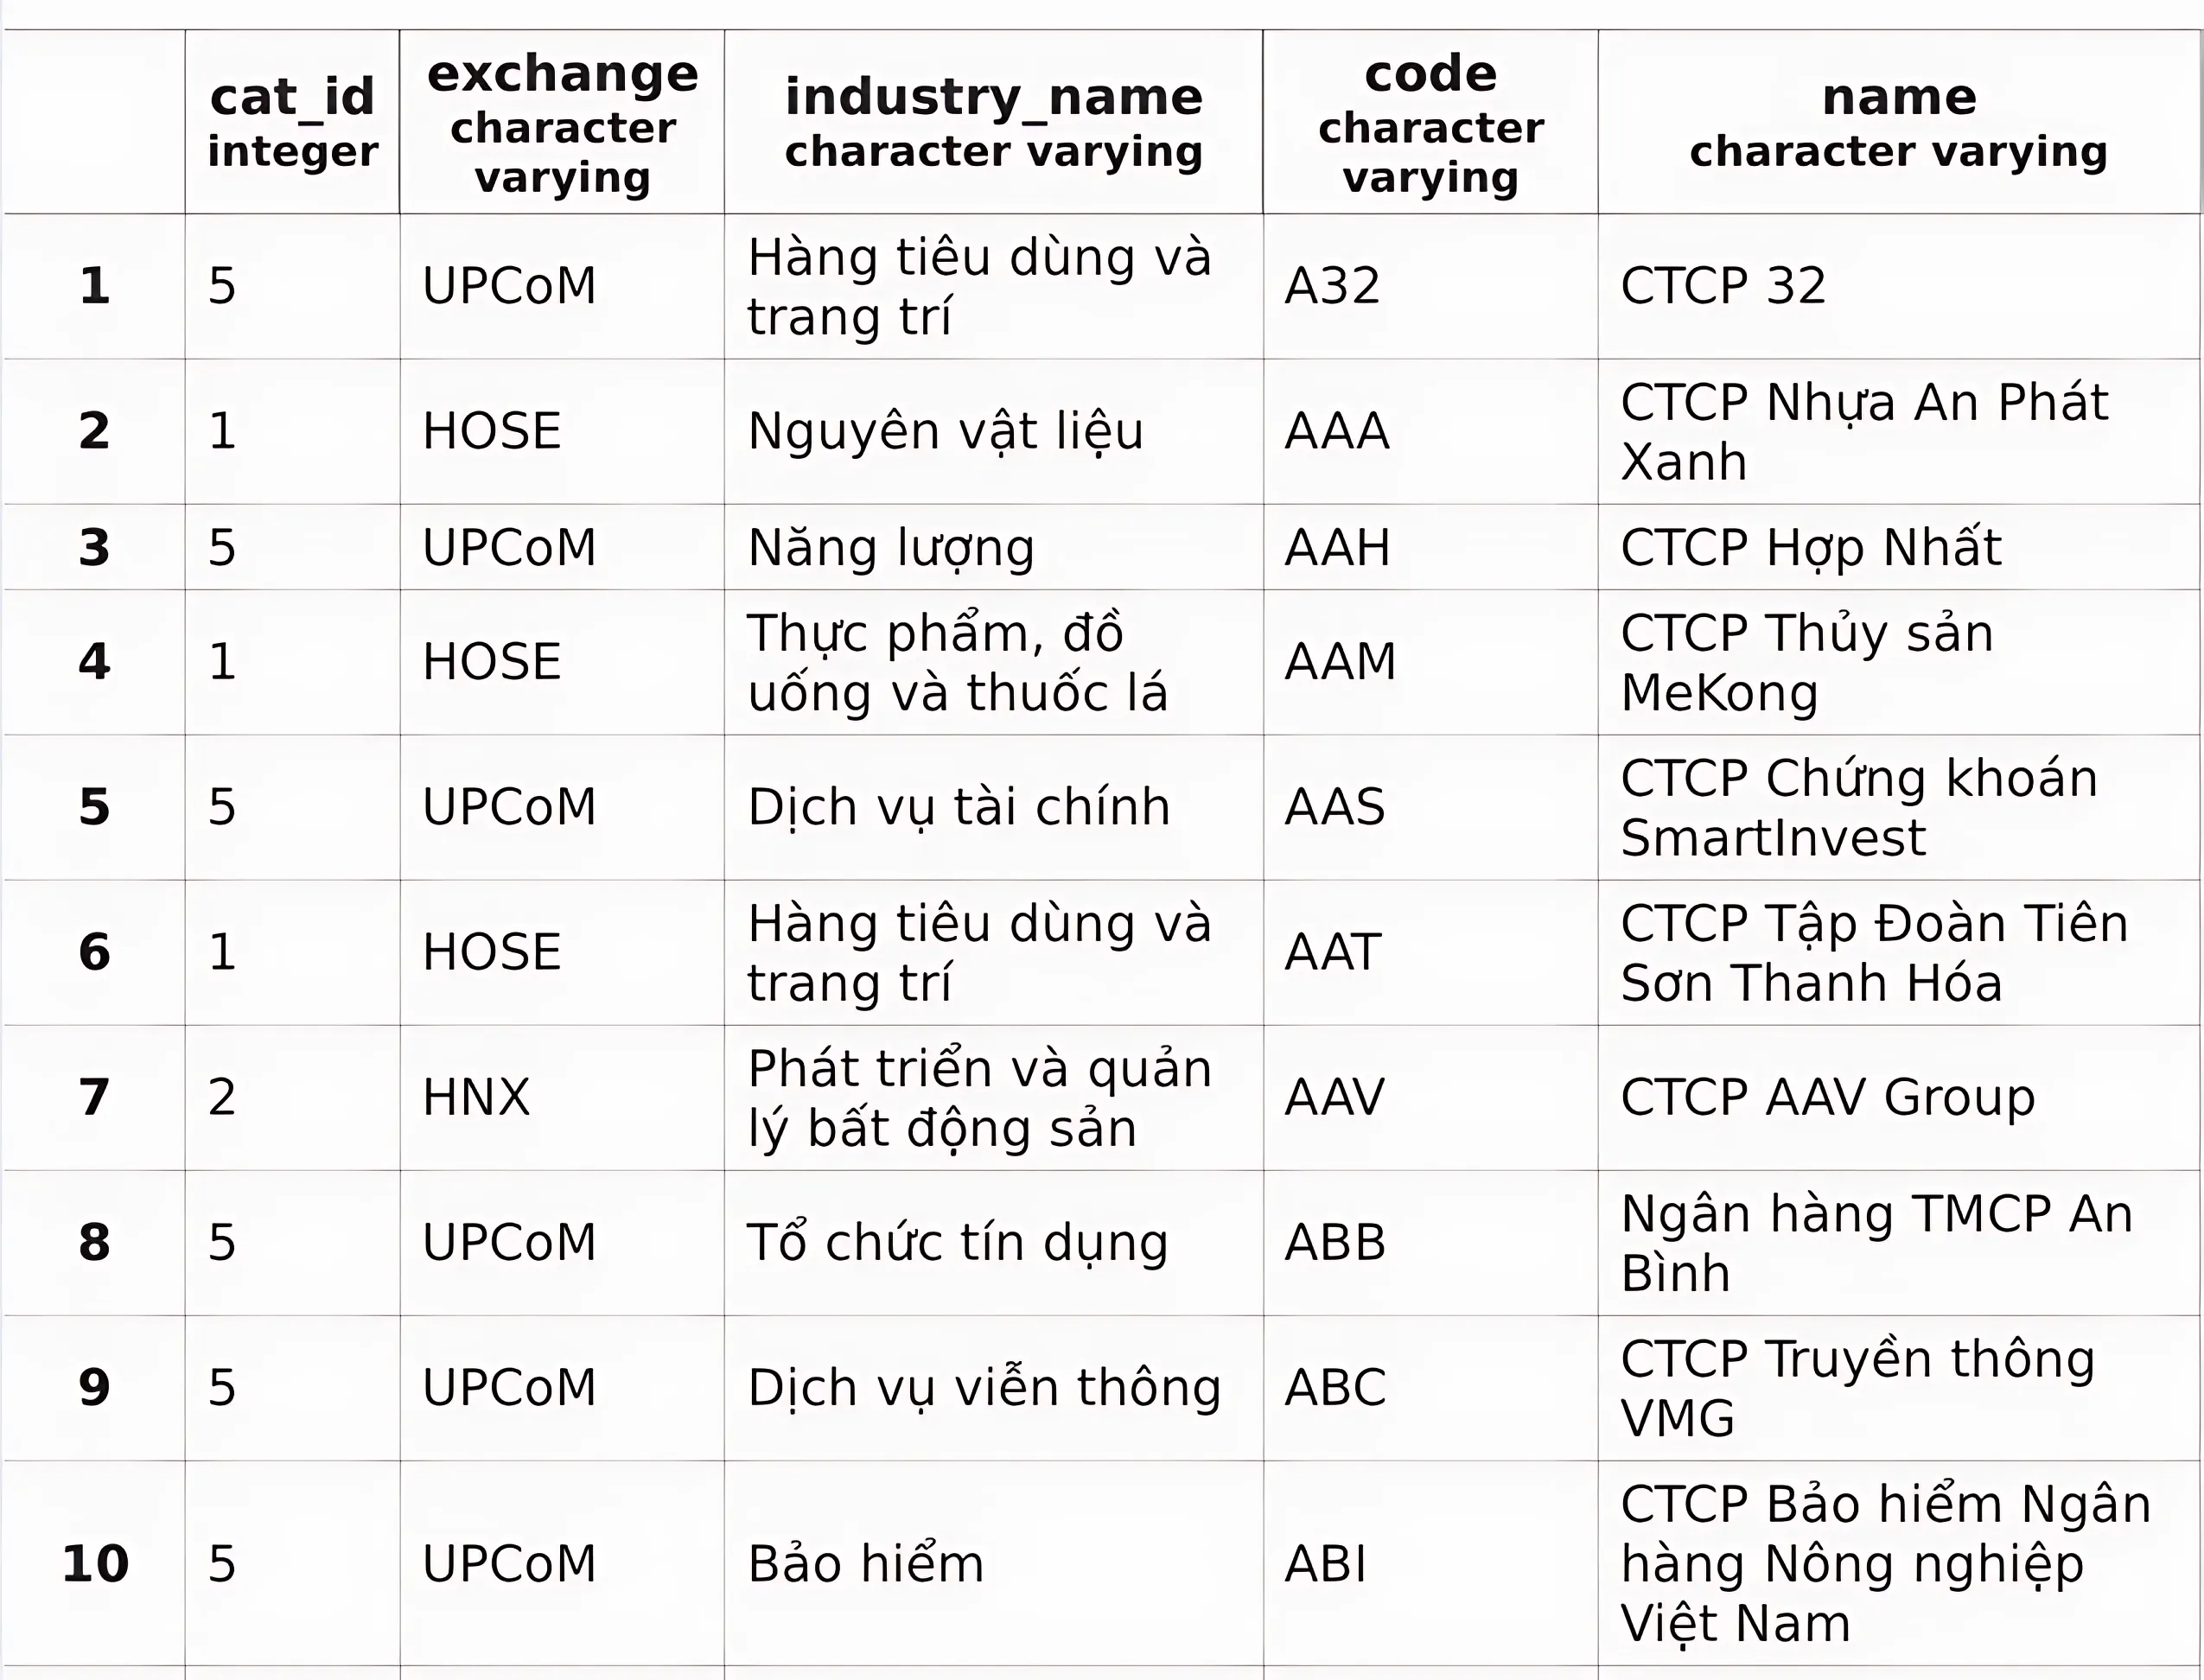
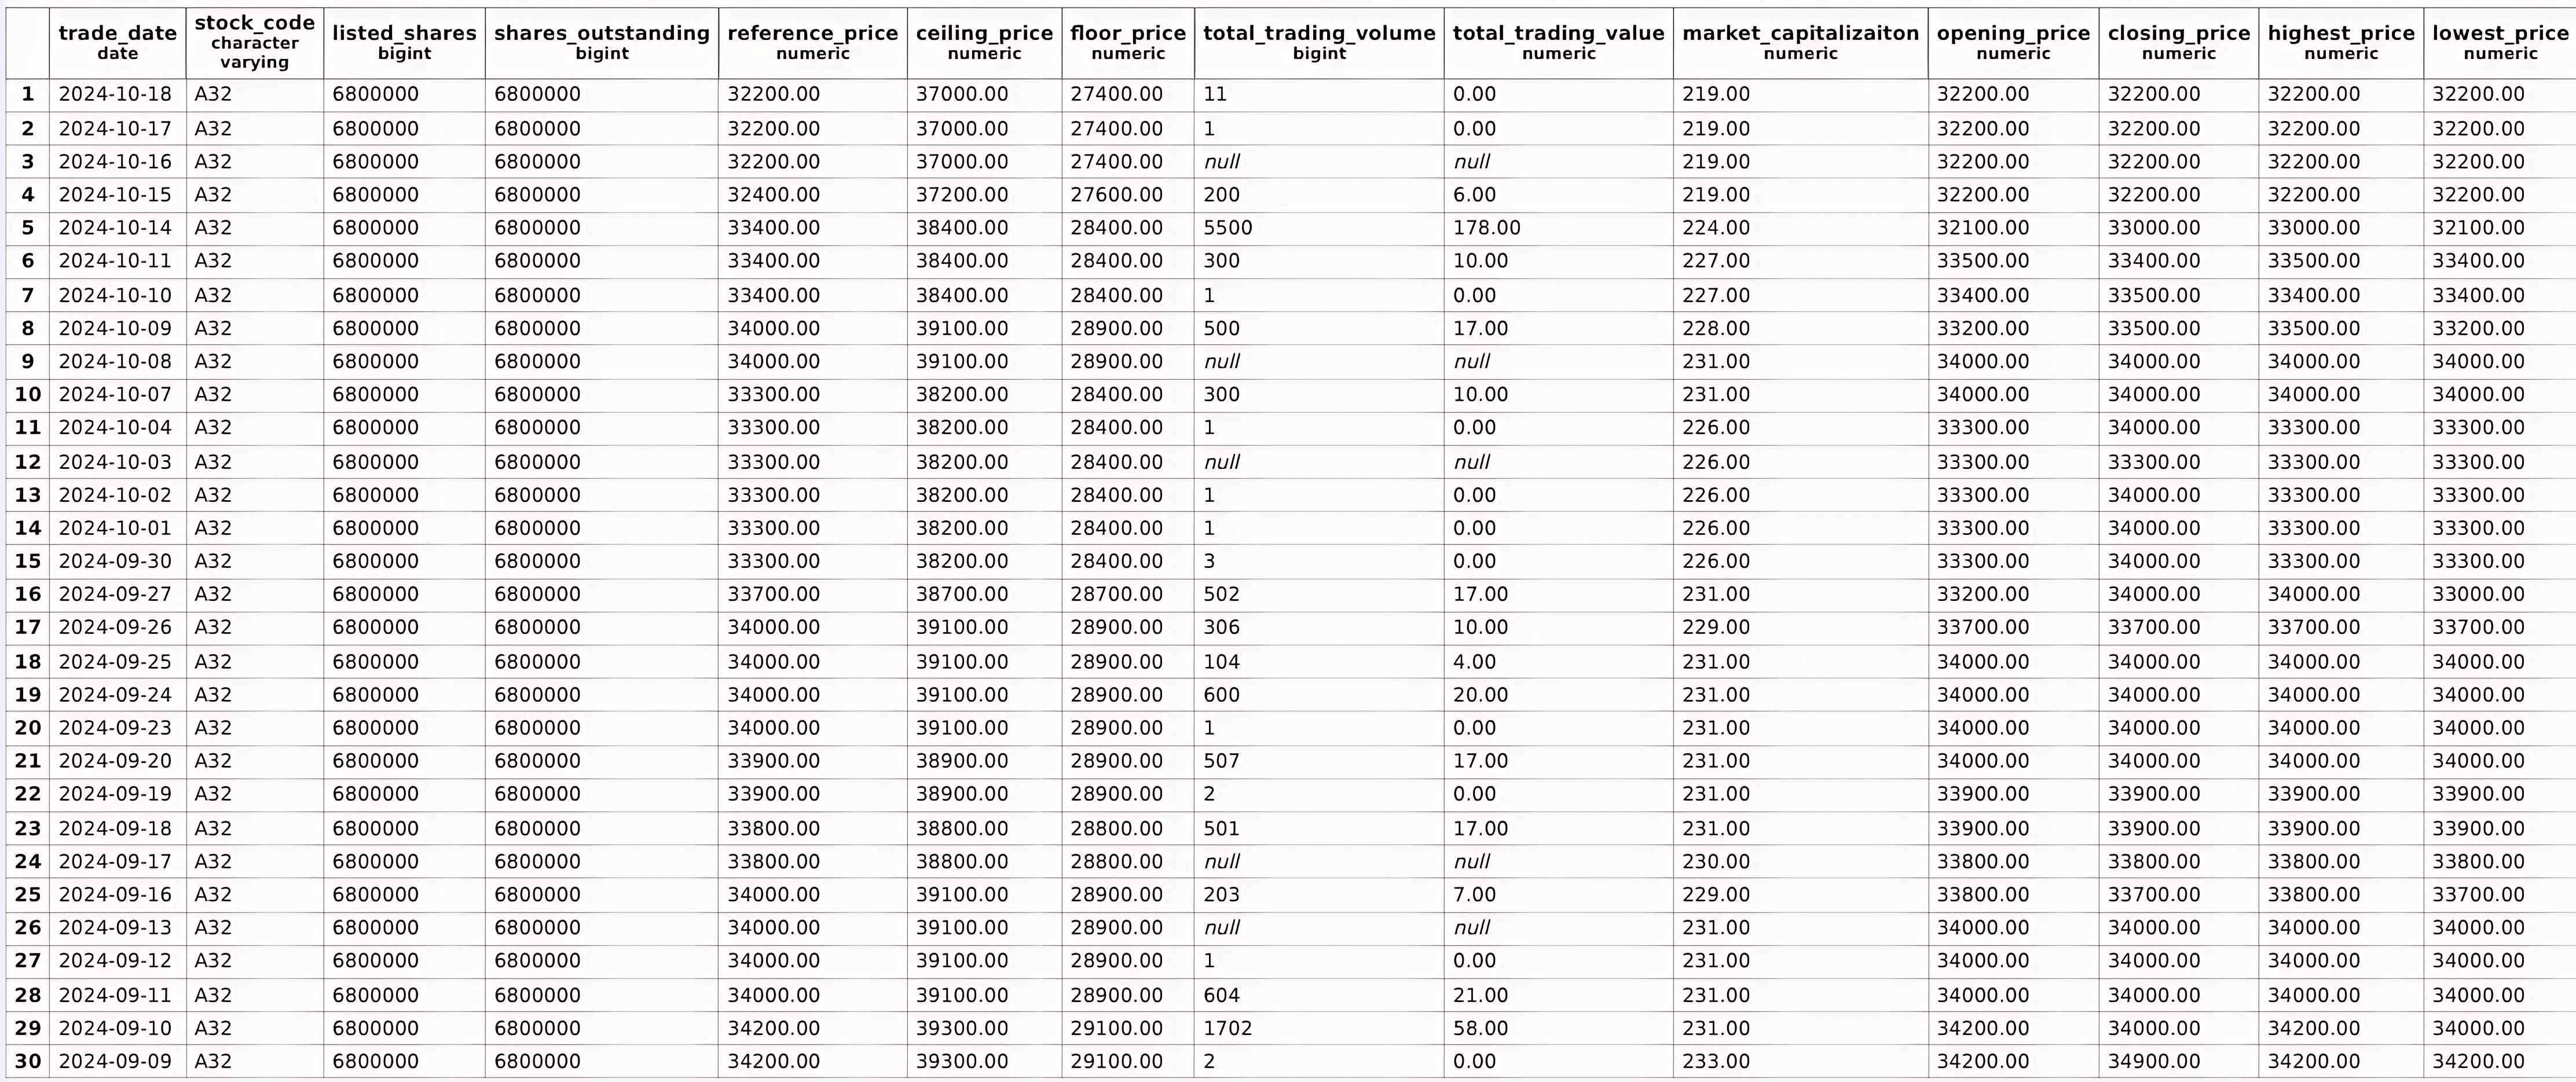
So the data will look like this:
After performing data preprocessing and cleaning we did exploratory data analysis to gain insights about the stock market, all of them are shown in the dashboard below.
The Dashboard
Our dashboard, will have a totally four pages:The main page, overview page, detail page and the chatbot page.
Main page
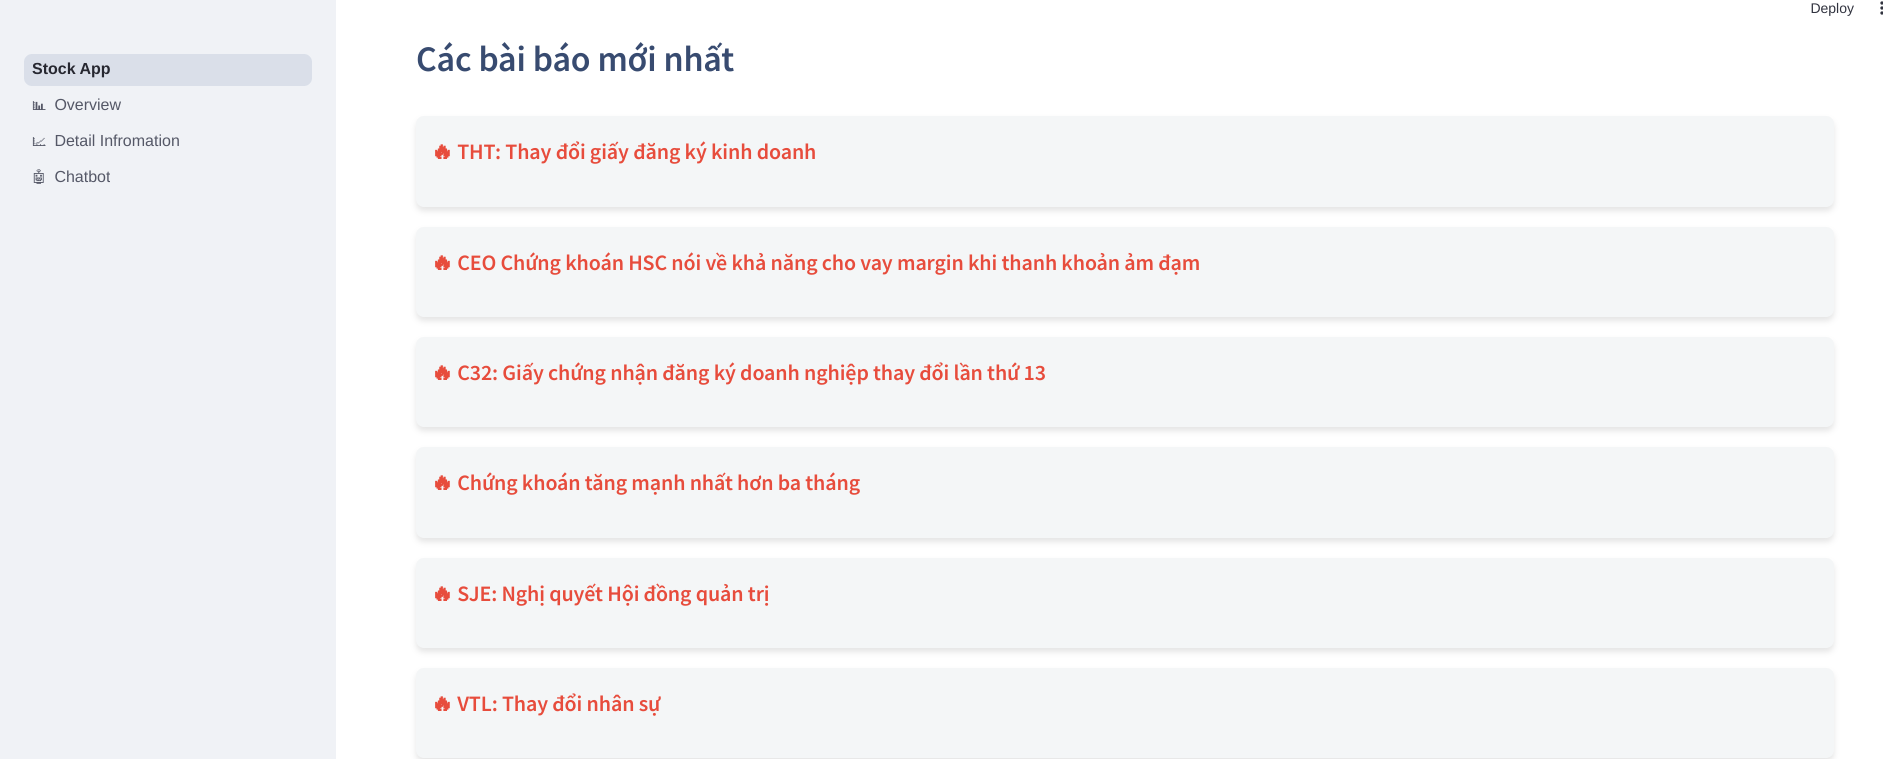
The main page will give us introduction about the dashboard, go with the lastest articles about stock.
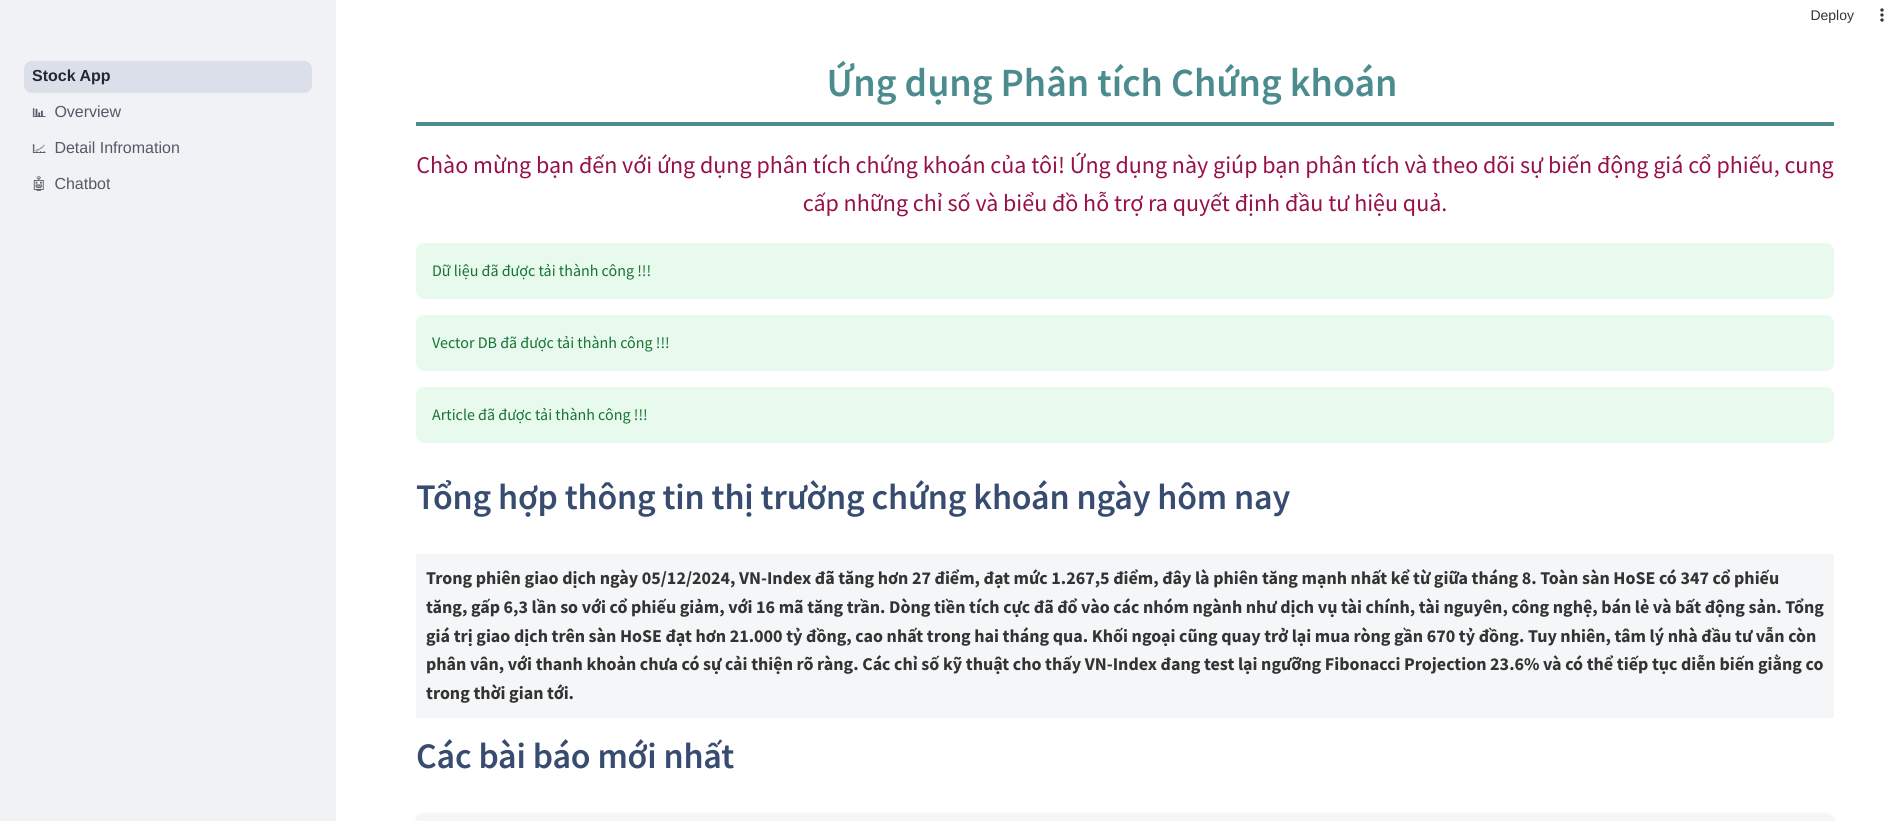
Stock overview page The next section of the dashboard provides an overview of the stock activity in the previous day. It display the change in stock prices, the market index value and and key financial metrics for the most promising companies. This page help everyone easily notice about the recent market’s performance.
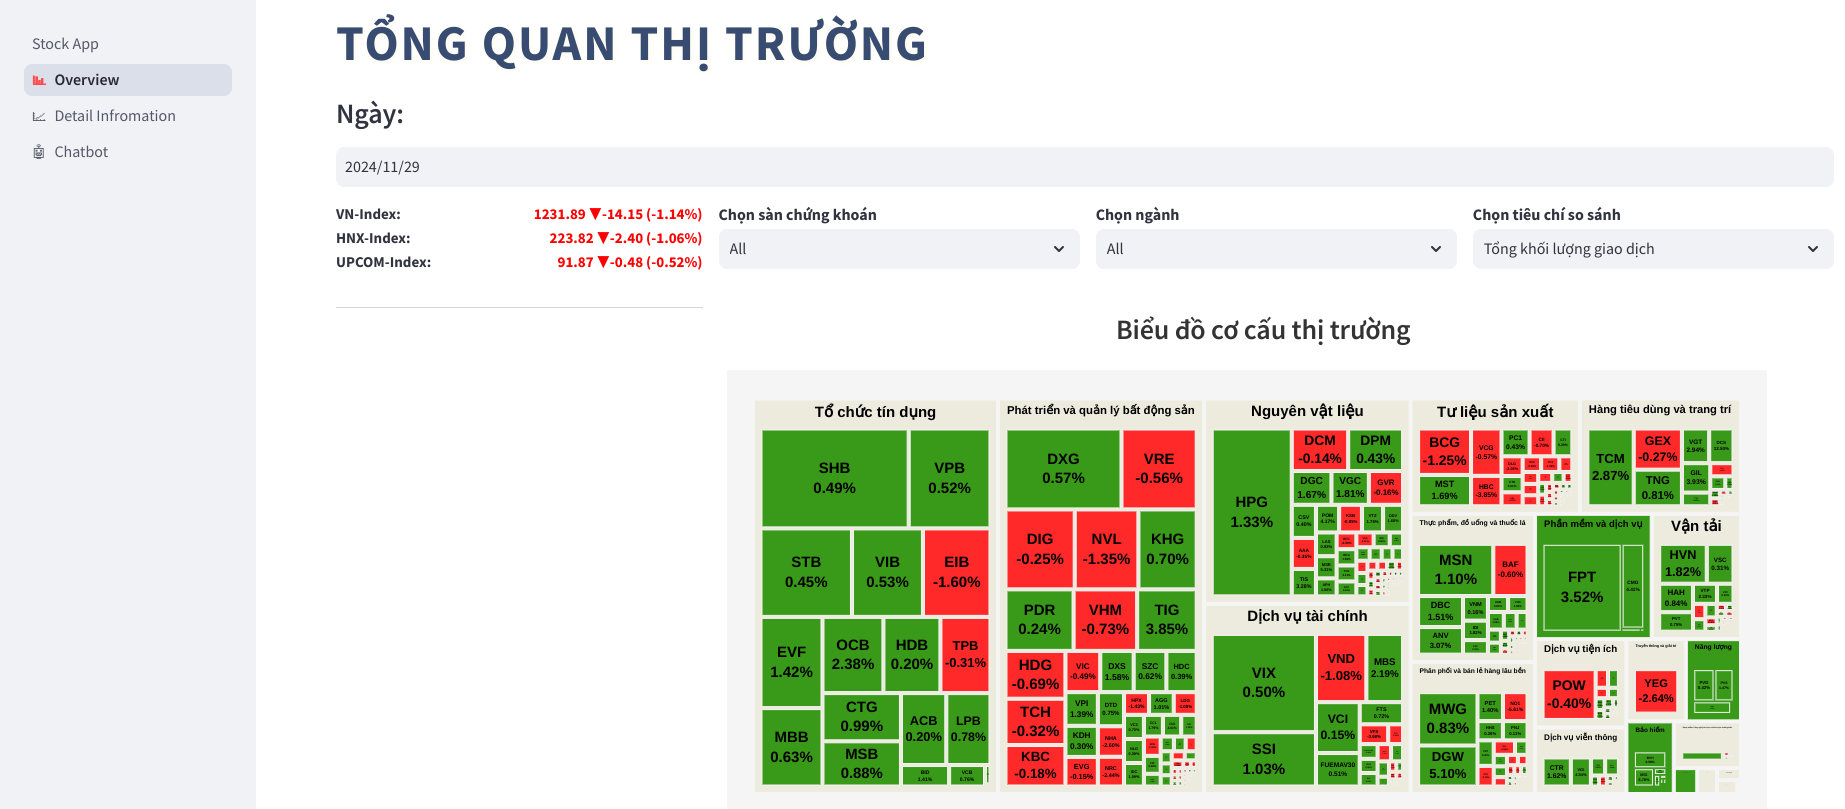
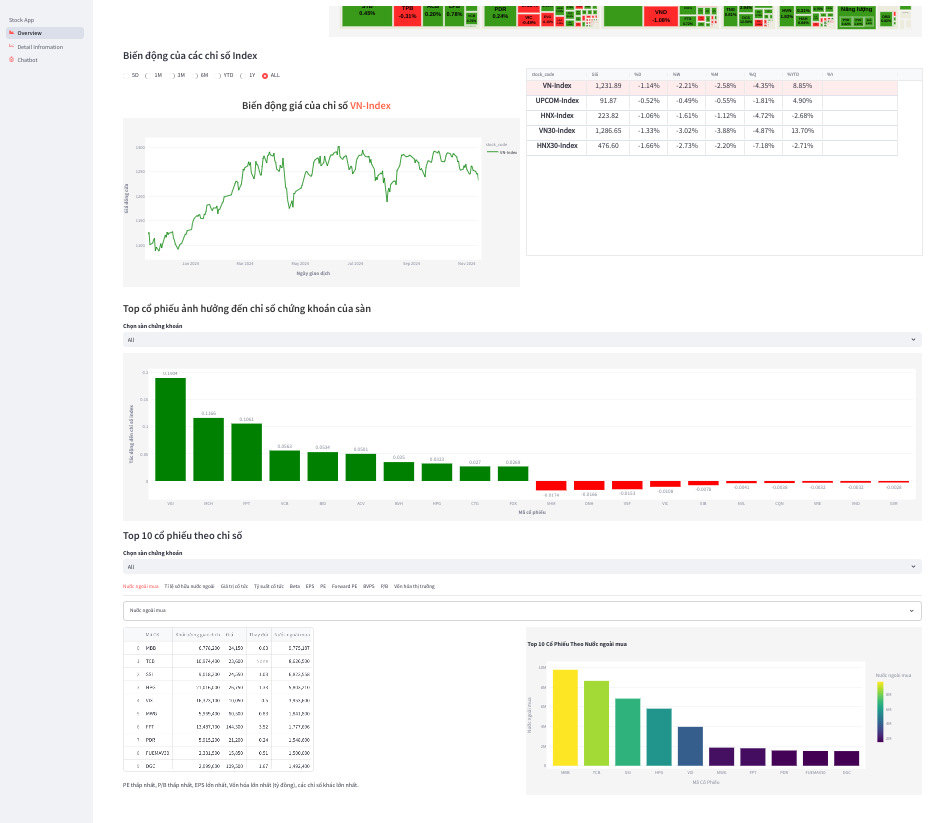
Based on the overview, we can identify low-risk candidates which worth to explore futher. To dive deeper in these companies, we can move to the detail page.
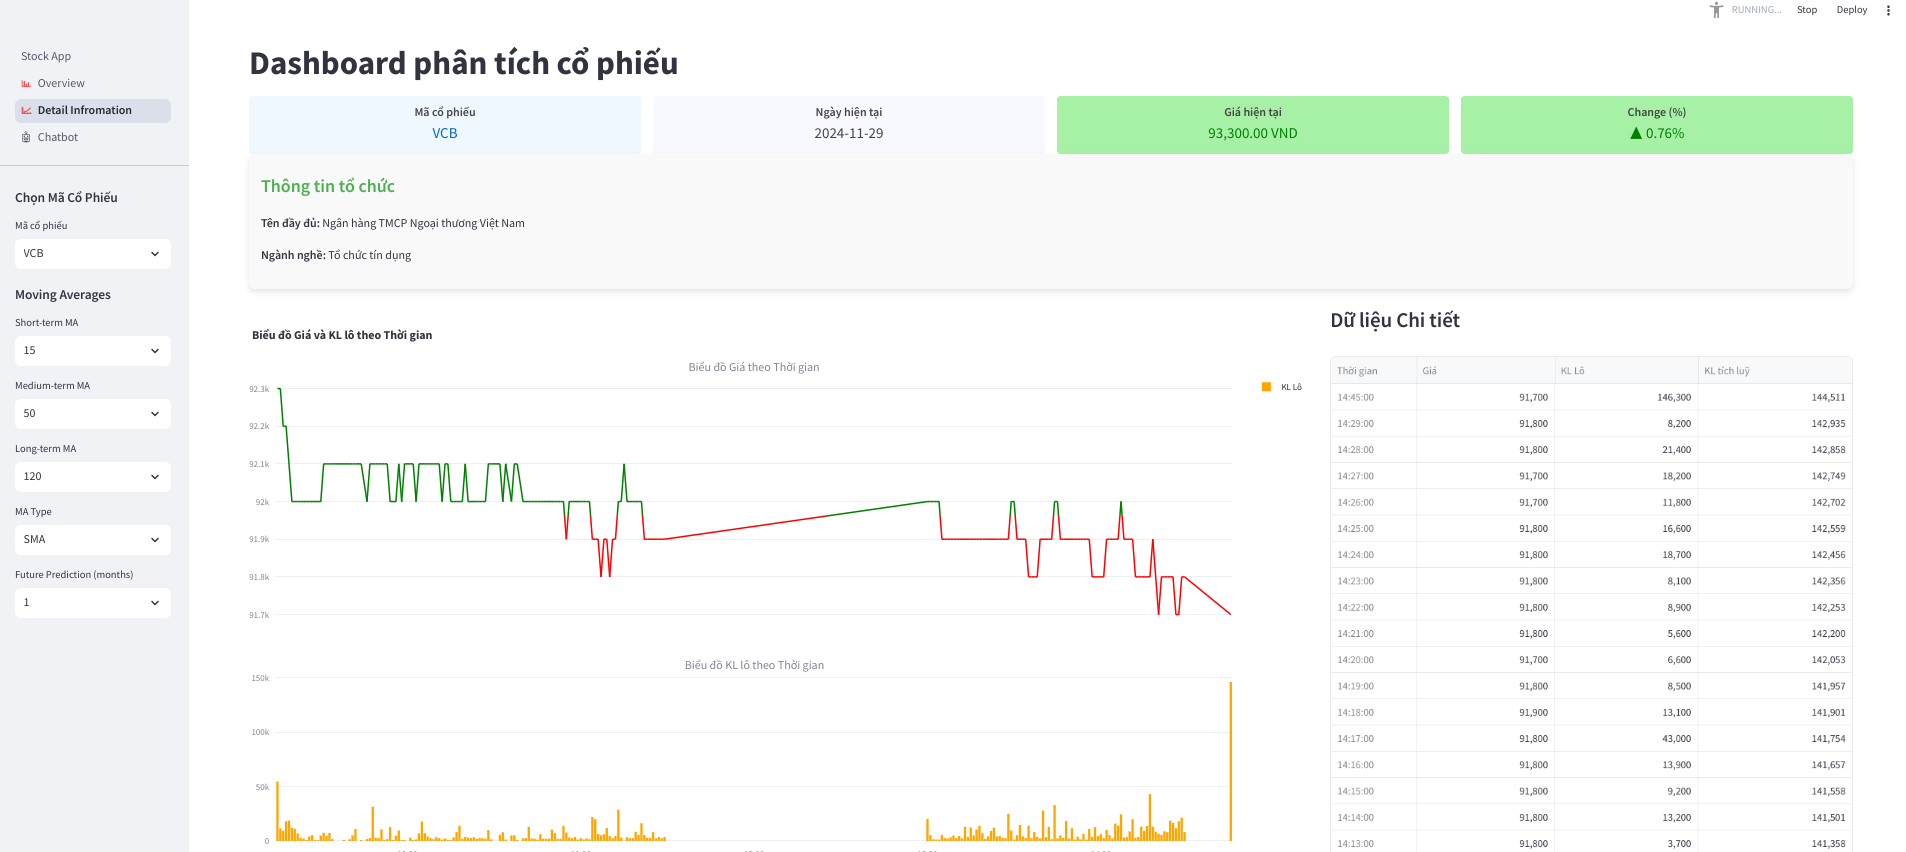
Detail page
The detail page will display the detail inforamtion about the stock of a company (we can choose the company code and some addtional parameter in the sidebar)
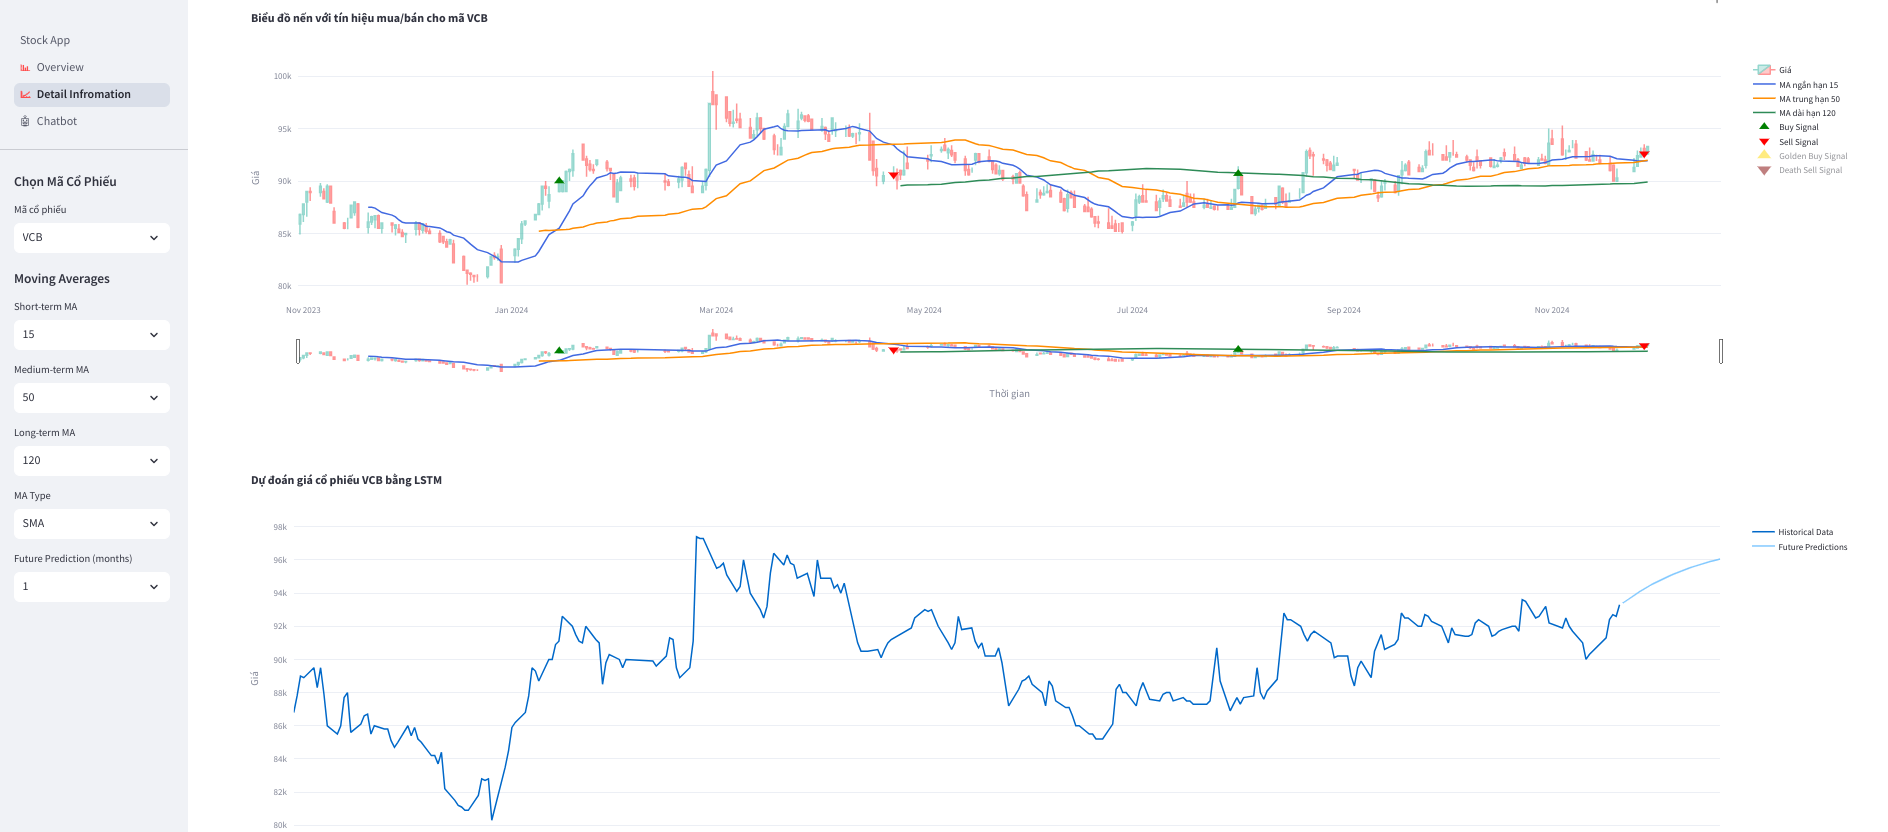
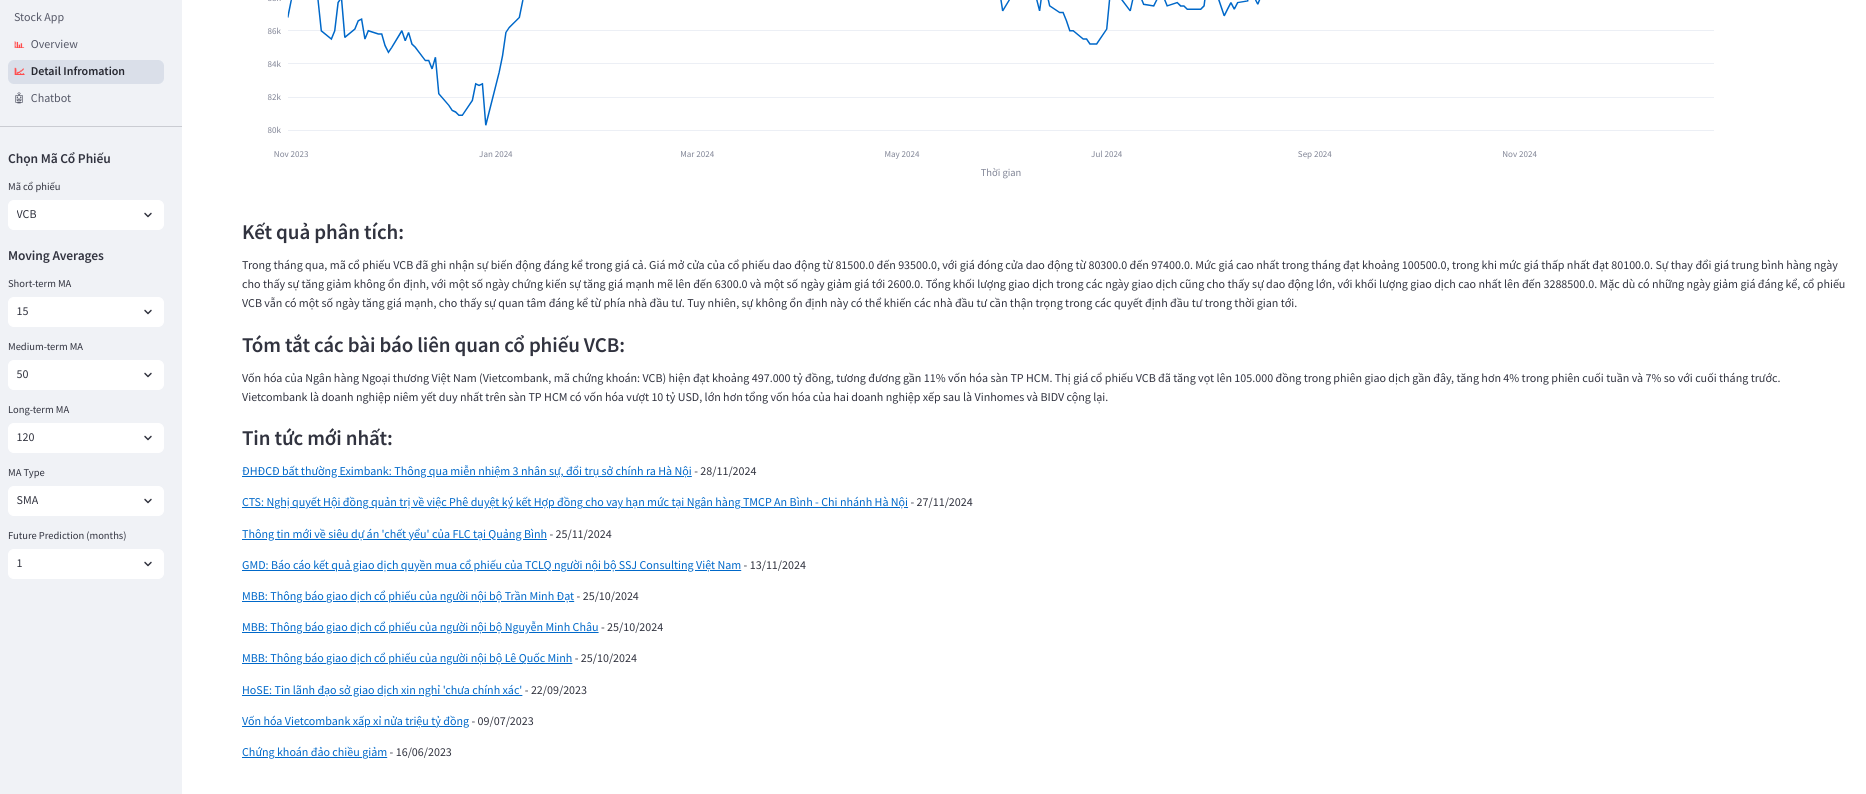
The infomation will consist of the detailed price change by minutes, the candle plot which sell and buy signal, the future prediction, the analysis genrerated by LLM and some news about the company.
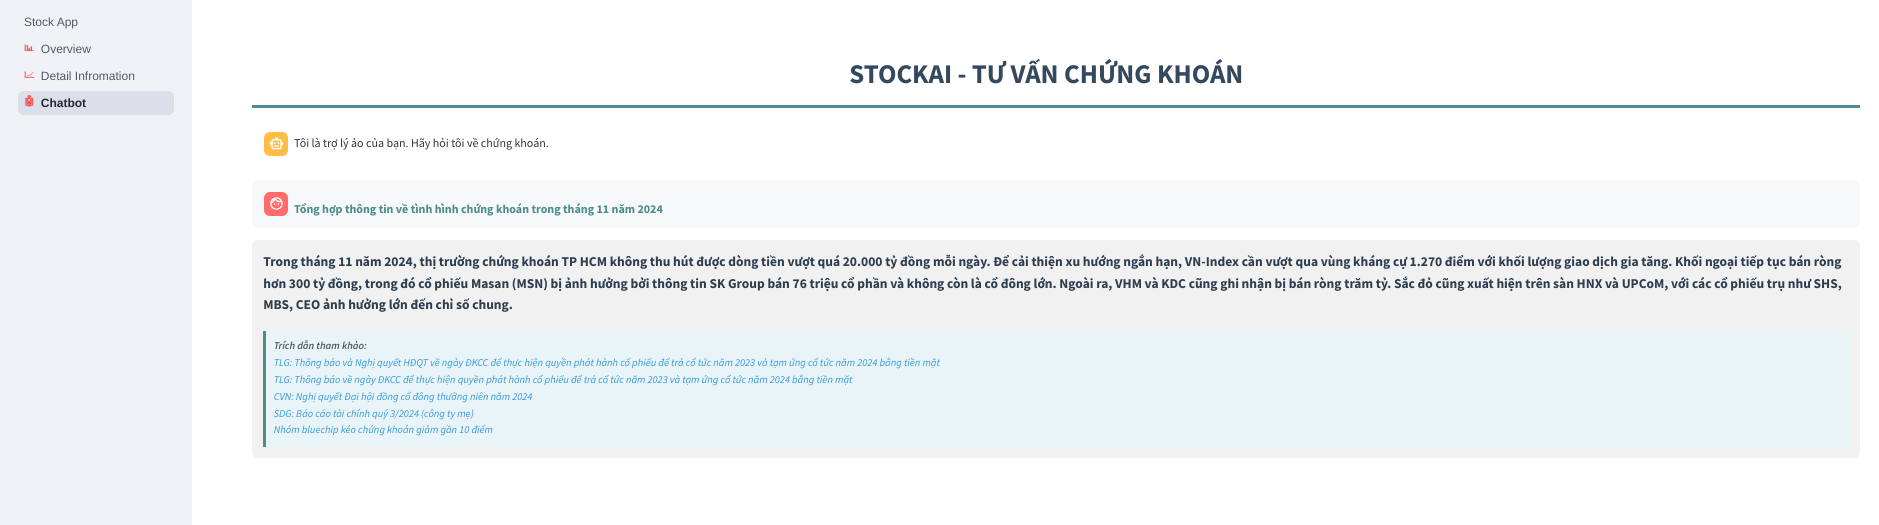
And finally, the third section of our dashboard is the chatbot, which will aggregate and extract the information from the financial news articles to answer our questions about the current stock trends and events.
Conclusion
In this project, beside my main responsiblities: building the data collecting pipeline, orchestrating it with AirFlow and developing the overview page in dashboard, I am also a team leader. In this role, I have to assign tasks for my team members based on their strength, create the project plan then trace our developing process.
It was a good experience where I not only improved my technical skills but also learned a lot about project planning, leadership, and effective teamwork.
Overall, this project give me greate chance to learn about financial data, natural language processing techniques, and apply intelligent analysis in a real-world context.